
Comparing metric performance over separate periods is important for Shopify App developers who want to track the growth, analyze trends and make informed decisions for their app’s business strategy. This guide walks you through the process of comparing data across different time frames with SaaS Insights.
Comparing data ranges is available for all metrics including Monthly Recurring Revenue (MRR), Annual Run Rate, Annual Revenue Per User (ARPU). A full list of metrics is available on the SaaS Insights Features page.
To compare date ranges, open up a metrics individual page. Then on the chart click the Compare Dates button.

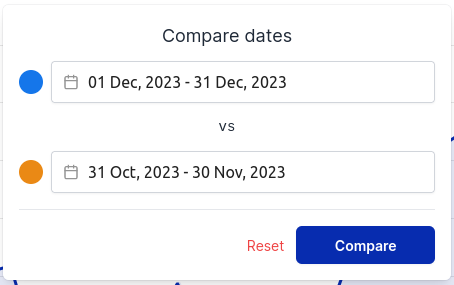
Now select the date ranges you want to compare. By default it’ll be the preceding period however they can be separated by days, months or even years.
Once you’ve chosen your date ranges, click the Compare button.
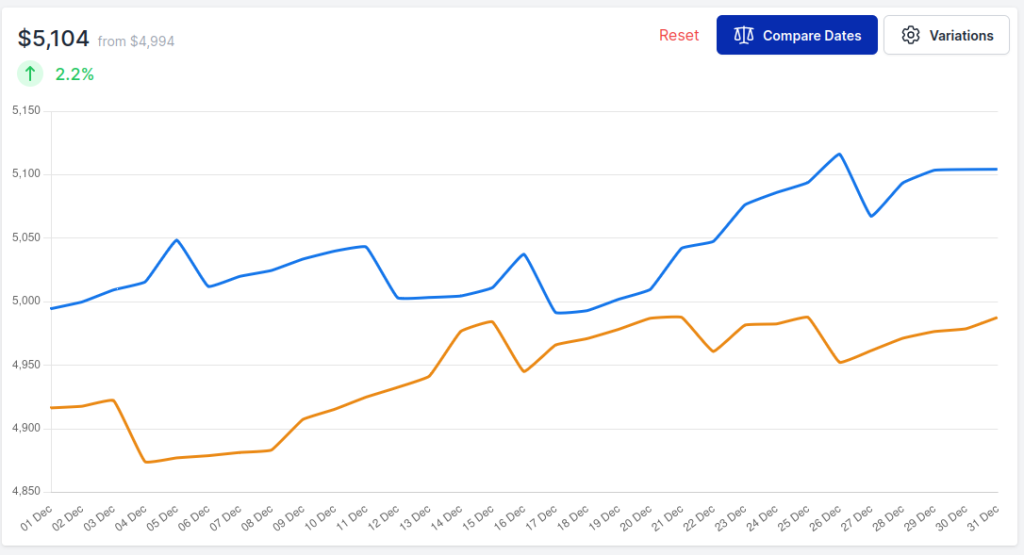
You can now compare the two data sets.
This feature was made available 28 March 2023. For other updates checkout the Changelog.